We’ve revamped how we present the financial details and related statistics for the classes.

The emphasis has shifted from delivering the raw numbers, to understanding how the numbers fit together. Since a successful enrichment program is complicated and can be viewed from several different perspectives, we wanted to make it easier to quickly get a high-level perspective, and to also get a better, more intuitive, feel of how everything breaks down.

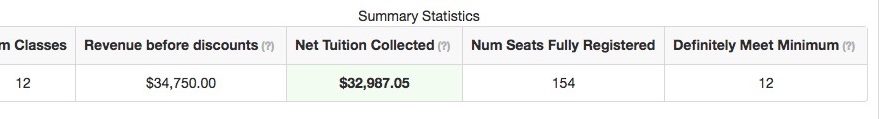
The old version, seen above, mainly lists the important statistics. To start with, we replaced the list of statistics with a top-level Dashboard that shows the number of classes being offering, the top-line revenue, the actual cash collected, the number of tickets sold, and the number of classes that meet their minimum requirements.

A quick tap on “Detailed Statistics” lets see how the money breaks down.

The “Cash Breakdown” (seen above) shows, for Registered students, how the money is split between Revenue, Fees, and Financial Aid.

The “Revenue Breakdown” (seen above) box mainly lets you see the amount of Receivables, before their fees and any allocated fin-aid, that is outstanding.

The “Class Breakdown” (seen above) gives you a quick sense how many classes might, or might not meet, depending upon who is meeting their minimums.

Lastly, the “Seat Fulfillment” (seen above) breakdown gives you a sense for how many people are have signed up, and how many more people could potentially sign up.

The improved Financial Aid Dashboard now quickly groups by Registered, vs. Almost Registered, and helpfully shows the total amount of Financial Aid offered.
The Detailed Breakdown lets you compare what is requested against what is granted, and what is accepted.
We’ve also simplified the sidebar, just showing the collected revenue of the class, the amount in receivables, and a financial aid count. If there are outstanding receivables, we’ll highlight it for you.
